Forex technical analisI will post here my weekly technical analysis on popular currencies pairs.
Today i will cover USD/CAD so lets get started, look at the daily chart
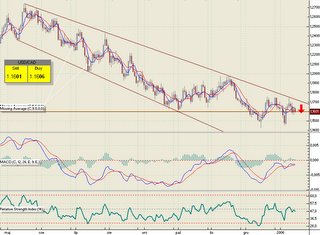
Not much to talk about but we can get clear picture of what is going on, this pair is currently heading down and is near the resistance level, so it will be proboably go down as this is very strong resistance (tested many times). Now look at MACD histogram, the divargence is very small it indicates that bull momentum is very weak, so i think USD/CAD will stay bearish.
Now lets look at 4H chart

-Check out trendline, it was hit 3 times so it is quite important trendline
-Now look at Fibbonaci retracemnet last bull move was retraced to 66%, and it looks like this resistance level was strong enough to defend itself
-Look at RSI i put a trendline on it and we can clearly see that RSI is also in bullish trend
So putting it all together i think we will have short term bullish run back to 1.1725+-25 pips and then double top on 4H chart will be formed which ofcourse mean trend reversal and market will become bearish.
Quick fundamental analis.
CAD is strongly correlated with oil price wich is heading up, so CAD will most likely get stronger and stronger, on the other hand USD is also heading up but it is not as strong as CAD is.
So there is high probability of bearish trend.
What to do?
This is what i will do, but keep in mind that no one knows where the market is going so i can easily be wrong.
I will take long position near the resistance level about 1.16 and put stop loss based on 15M chart so you have to do it yourself but i won't make it more than 30pips away from opening price, and i will put take profit somwhere about 100 pips away from open price proboably 1.1725.
When the bullish move will end i will wait for a trend reversal candle (1D chart).
So this is it, waiting for your comments.